
Our Outspoken View on the Yield Curve Inversion

The media is buzzing about the current state of the yield curve as portending an economic recession. We’re not as up in arms as many industry participants and do not feel this is a strong indication that you make a wholesale move out of the stock market. Here’s our view on the current yield curve inversion.
Yield curve defined
First of all, what is the yield curve? The yield curve is a graphical depiction of the yield, or coupon payment versus face value, for US Treasury securities of various maturities.
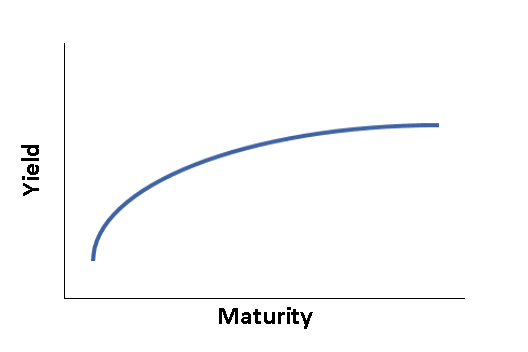
The yield curve typically looks like a ski slope tilted upwards, meaning that yields for shorter maturity instruments (6 months to 2 years) tend to be lower than longer maturity ones. This is because investors aren’t taking as much time-related risk with shorter term fixed income securities, and thus don’t need to be compensated as highly with yield. As the maturity increases (e.g. 10 year Treasury bond), the yield typically rises. Investors need more “compensation” in order to be incentivized to take higher risk. As a result, you usually see the curve rise as you move from left to right.
A yield curve inversion happens when the yield on the longer-term securities falls. When this happens, it is usually attributed to a few things going on:
There’s been a stock market sell off and people are buying longer term bonds (which are seen as a “safe haven” investment) with the proceeds. This drives down bond yields (as prices of bonds are bid up, the yields to those investors drop).
As the Federal Reserve controls the short end of the yield curve (Treasury bills), any raising of the Fed Funds rate would increase yields for shorter term instruments, causing the left side of the curve to rise relative to the right.
Not always that telling
We accept that there is a loose relationship between the shape of the yield curve and the stage of an economic cycle. However, the truth is that yield curve inversions haven’t happened very much in the last half century, so it’s hard to draw a very strong link between them and recessions (Crill, 2018). For example, an inversion occurred in March 2019 between the 3 month Treasury Note and the 10 year Treasury bond, and no recession has yet ensued (Ellis et al., 2019). In any type of analysis, it is challenging to draw a definite conclusion when the data set is so limited.
Consider also what history tells us about the amount of time between an inversion and a recession. Recession has happened from nearly 8 months prior to inversion to up to about 20 months afterwards (Ibid.) Suffice to say, this is not an exact science and there are a number of factors that come into play during this protracted time period that can trigger or stall the recession’s onset.

What this means for you
What can and should you do as an investor if you are concerned about the stock market given this news? Sticking to a long-term strategy is going to be more important than reacting to any short-term noise. Remember, market timers must make two correct decisions in a row: the day to get out, and the day to get back in. As shown in the adjoining chart, missing even a few of the best performing days in the market can cripple performance and could wipe out any gain you might achieve even if you did discover a yield curve timing model (Resick et al., 2002). We suggest that investors stay the course and hold off on making any major trading decisions.
Personal investment decisions can only be made on a case by case basis and take into account such factors as your tolerance for volatility, liquidity preferences, and income needs. Please feel free contact us with any questions you may have.

Contributor
Chris Jaccard, CFP®, CFA is a lead advisor with Financial Alternatives in La Jolla, CA. When he’s not working on home improvement projects or trying to keep up with his kids, he loves to help successful families consider their alternatives and make better financial choices with the EXPERT™ Advisory Process. Schedule a time to chat about your situation or the latest project.
Sources
Crill, Wes, Phd. (August 2018). What does a yield curve mean for investors? Dimensional Fund Advisors.
Dimensional Fund Advisors. (November 2018). The Flat Out Truth.
Ellis, Chad, and Lubas, Amy, CFA. April 2019. Market Digest: What Does Yield Curve Inversion Mean? Ned Davis Research.
Bruce G. Resnick & Gary L. Shoesmith (2002) Using the Yield Curve to Time the Stock Market, Financial Analysts Journal.
Performance of the S&P 500 Index - Chart
The missed best day(s) examples assume that the hypothetical portfolio fully divested its holdings at the end of the day before the missed best day(s), held cash for the missed best day(s), and reinvested the entire portfolio in the S&P 500 at the end of the missed best day(s). Annualized returns for the missed best day(s) were calculated by substituting actual returns for the missed best day(s) with zero.
S&P data © 2019 S&P Dow Jones Indices LLC, a division of S&P Global. All rights reserved. “One-Month US T- Bills” is the IA SBBI US 30 Day TBill TR USD, provided by Ibbotson Associates via Morningstar Direct. Data is calculated off rounded daily index values.